The 5 best data visualization RStudio Package
Share
Hello everyone! Today, I will be talking about the 5 best data visualization packages for R. If you work with data, you know how important it is to be able to visualize it effectively in order to understand trends and relationships between variables. There are many available packages for R that allow for creating impressive data visualizations. In this article, I will be presenting the 5 best data visualization packages that I strongly recommend testing. They will help you better understand and communicate your data. So, without further ado, let’s dive into the packages!
The best packages for data visualization on RStudio
ggplot2
ggplot2 is one of the most popular visualization packages for R. It allows for creating high-quality graphs with a clear and concise syntax. ggplot2 is particularly useful for creating faceted graphs, histograms, boxplots, and density plots.
Discover the main features of ggplot2 here
lattice
lattice is another popular visualization package for R. It allows for creating trellis graphs, stacked histograms, scatterplots, and other types of graphs. lattice is particularly useful for visualizing multivariate data.
plotly
plotly is an interactive visualization package for R. It allows for creating online graphs that can be easily shared with other users. plotly offers a wide variety of graph types, including bar charts, pie charts, scatterplots, and maps.
leaflet
leaflet is a map visualization package for R. It allows for creating interactive maps that can be embedded in R Markdown documents or websites. leaflet is particularly useful for visualizing geospatial data.
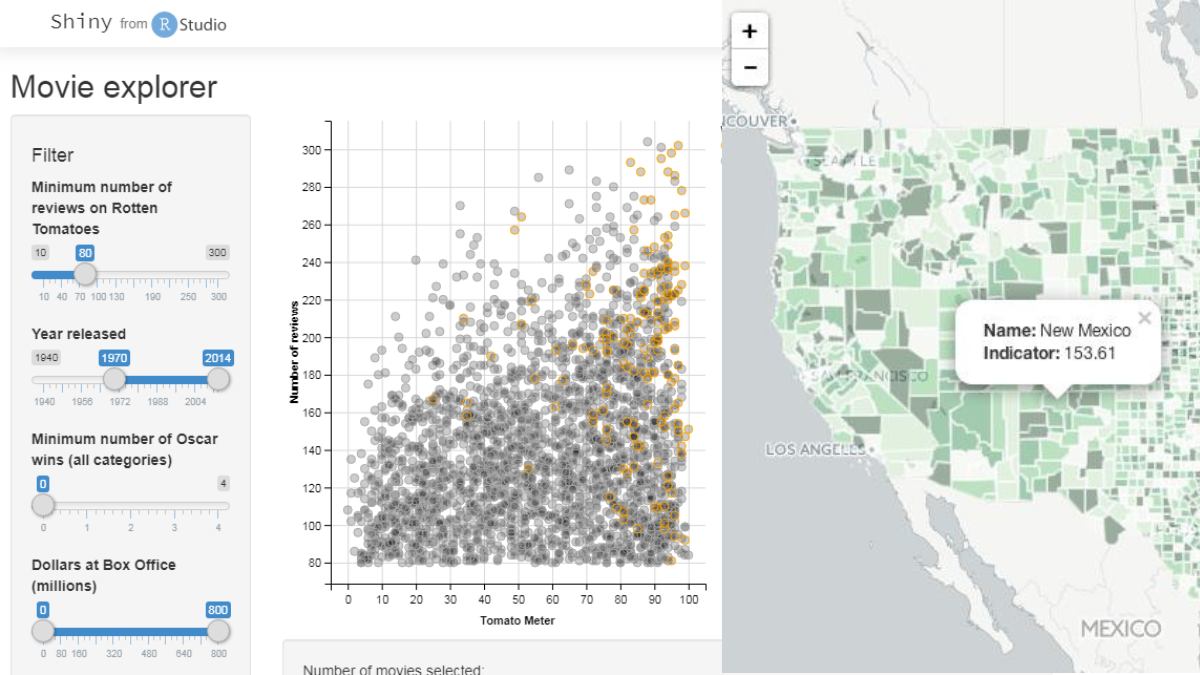
Shiny
Shiny is a web application development package for R. It allows for creating interactive R-based applications that can be shared online. Shiny is particularly useful for visualizing real-time data.
In conclusion, there are many visualization packages available for RStudio that allow you to create high-quality graphics. Interactive or not, all these packages are versatile choices that can allow you to visualize most of your data with RStudio.
