[et_pb_section admin_label=”section”] [et_pb_row admin_label=”row”] [et_pb_column type=”4_4″][et_pb_text admin_label=”Text”] Web scraping is the process of retrieving data from the web from websites. It can be useful to retrieve data for research purposes, technology watch or simply to create a data history for later analysis. Today I propose to guide you step by step to discover how to […]

Learning to use R and RStudio can seem daunting, but with the right background knowledge, it can become an easy and fun task. Before you start, you’re probably wondering what basic knowledge is needed. Do I need previous programming experience? Do I need a strong background in mathematics and statistics? What tools should I use […]

The R programming language is increasingly used in the fields of data science and statistical analysis. It is a powerful and flexible open-source tool for manipulating and visualizing data, writing functions and using R packages. This guide will show you the steps to get started with R, from installation to creating professional-quality graphics. It is […]

Welcome to the exciting world of RStudio! If you are new to the world of R programming, you’ve come to the right place. RStudio is an incredibly useful integrated development environment (IDE) for R users who want to enhance their programming experience. It is easy to use, user-friendly and offers an attractive interface for working […]

Data analysis is an ever-evolving field that requires the use of powerful programming languages. Two of the most popular options are R and Python, each with its own features and benefits. So, which is the best choice for data analysis? That depends on your goals and programming experience. In this article, we’ll look at the […]

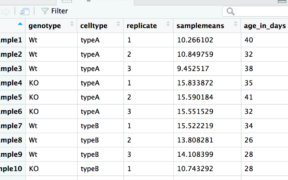
If you want to tackle R, it is essential to start by creating a dataframe.. Creating a data frame with RStudio is a relatively simple process. You need two things: data and the RStudio software. Creating a data frame is done using the data.frame() function. You can either enter your data manually into RStudio as […]

Histograms are a useful visualization for representing the distribution of a quantitative variable. With ggplot2, it is easy to create attractive and customized histograms using the geom_histogram() function. Histograms are what we call one-variable charts, because you only see one variable, which makes it a very simple chart to use. How to create a histogram […]
inspect the structure of a data frame Visualize the column headers Knowing the number and length of a variable in a data frame Several functions allow to go into details about the size and the number of entries in the different variables.The levels() function gives the list of obs. of a variable,The length() function gives […]
How do I identify R data types? There are several types of data structures in R, each with specific characteristics and uses. To get the most out of the R language and RStudio software, it is essential to understand them and know how to interpret and use them. In this article, we will explore the […]