
Data analysis is an ever-evolving field that requires the use of powerful programming languages. Two of the most popular options are R and Python, each with its own features and benefits. So, which is the best choice for data analysis? That depends on your goals and programming experience. In this article, we’ll look at the […]
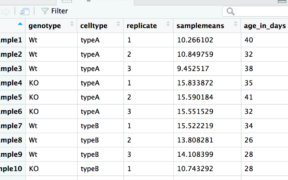
If you want to tackle R, it is essential to start by creating a dataframe.. Creating a data frame with RStudio is a relatively simple process. You need two things: data and the RStudio software. Creating a data frame is done using the data.frame() function. You can either enter your data manually into RStudio as […]
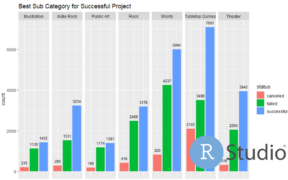
Histograms are a useful visualization for representing the distribution of a quantitative variable. With ggplot2, it is easy to create attractive and customized histograms using the geom_histogram() function. Histograms are what we call one-variable charts, because you only see one variable, which makes it a very simple chart to use. How to create a histogram […]
inspect the structure of a data frame Visualize the column headers Knowing the number and length of a variable in a data frame Several functions allow to go into details about the size and the number of entries in the different variables.The levels() function gives the list of obs. of a variable,The length() function gives […]
How do I identify R data types? There are several types of data structures in R, each with specific characteristics and uses. To get the most out of the R language and RStudio software, it is essential to understand them and know how to interpret and use them. In this article, we will explore the […]

If you’re interested in Data Analysis, you probably know that both R and Python are the two most popular programming languages used in that field. But if you’re not familiar with both of them, you might not know what is the main difference between the two of them and how they compare. Here are some […]
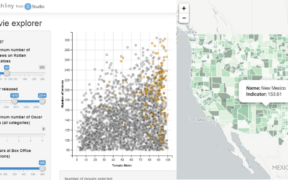
Hello everyone! Today, I will be talking about the 5 best data visualization packages for R. If you work with data, you know how important it is to be able to visualize it effectively in order to understand trends and relationships between variables. There are many available packages for R that allow for creating impressive […]
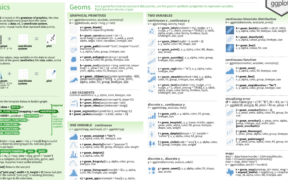
If you don’t know it yet, ggplot2 is one of the most popular packages for R. It is arguably the most iconic package for RStudio, also known and envied by python users. Besides having many possibilities to create attractive and powerful graphics, it is relatively easy to use but also very powerful. In this article, […]

The programming language R is particularly popular in the field of data analysis due to its power and flexibility. There are many packages available for manipulating data in R, each with its own features and advantages. In this article, we present the top 10 best packages for data manipulation in R. These packages have been […]