
Shiny Package for RStudio
Today, I’m introducing you to the Shiny package for R and RStudio. If you are an R user and are looking for a way to

Today, I’m introducing you to the Shiny package for R and RStudio. If you are an R user and are looking for a way to

Today I would like to tell you about an incredibly useful R package for data analysis: Tidyverse. If you’re a regular R user, you’ve probably

Hello everyone! Today, I will be talking about the 5 best data visualization packages for R. If you work with data, you know how important
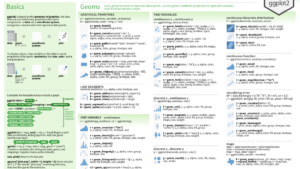
If you don’t know it yet, ggplot2 is one of the most popular packages for R. It is arguably the most iconic package for RStudio,

Today, I’m introducing you to the Shiny package for R and RStudio. If you are an R user and are looking for a way to
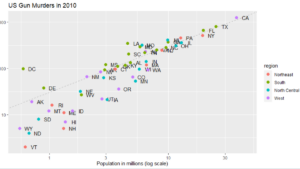
In this article, we will explore how to create a scatterplot using ggplot2, a data visualization library in R. After explaining your interest in the
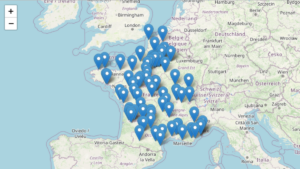
Do you need to create interactive maps for your spatial data analysis? Look no further! With RStudio and the leaflet package, you can easily create

Histograms are a useful visualization for representing the distribution of a quantitative variable. With ggplot2, it is easy to create attractive and customized histograms using